Toronto DineSafe Dashboard
Aggregated Food Safety Insights (2022–2025) By EdgeVance — Led by Vijit Singh, Business Systems and Data Analyst
Project Overview
This dashboard analyzes Toronto’s DineSafe inspection data to surface citywide food safety trends. It’s designed for public education, ethical transparency, and technical credibility—without exposing individual establishments.
- ✅ Aggregated only—no restaurant-level data
- 🧱 SQL Server schema (3NF) + Power BI star schema
- 🐍 Python ETL pipeline with logging and deduplication
- 📊 Dashboard built in Power BI Desktop (single-page, mobile-friendly)
- 🧠 Inferred pass/fail logic based on enforcement actions
Dataset Analysis
Before modeling, I conducted a detailed audit of every column in the DineSafe dataset to guide normalization. Each field was evaluated for:
- Repetition: Does the value repeat across rows? If yes, it likely belongs in a separate lookup table.
- Atomicity: Is the value indivisible? If not, it should be split into multiple fields.
Here’s the full breakdown:
| Column Name | What It Represents | Repeated? | Atomic? | Notes |
| _id | Unique value for this dataset | No | Yes | Internal Mongo-style ID |
| EstablishmentID | ID for an establishment | Yes | Yes | Used as primary key |
| InspectionID | ID for an inspection | Yes | Yes | Used as primary key |
| Establishment Name | Name of the establishment | Yes | No | Often contains multiple names separated by “–” |
| Establishment Type | Type of establishment | Yes | Yes | Normalized into EstablishmentType |
| Establishment Address | Full address | Yes | No | Split into street, unit, city, postal code |
| Establishment Status | Operational status | Yes | Yes | e.g., Active, Closed |
| Min. Inspections Per Year | Minimum inspections expected | Yes | Yes | Numeric field |
| Infraction Details | Description of violation | Yes | No | Contains both code and description |
| Inspection Date | Date of inspection | Yes | Yes | Used for time-series analysis |
| Severity | Magnitude of infraction | Yes | No | Contains both code and label (e.g., “M – Minor”) |
| Action | Enforcement action taken | Yes | Yes | Used to infer outcome |
| Outcome | Result of inspection | Yes | No | Some values ambiguous (e.g., “Conviction” with multiple meanings) |
| Amount Fined | Fine amount | Yes | Yes | Numeric field |
| Latitude | Geo coordinate | Yes | Yes | Used for mapping |
| Longitude | Geo coordinate | Yes | Yes | Used for mapping |
| unique_id | Unique identifier for each infraction record | No | Yes | Used as primary key in InspectionInfraction |
This comprehensive audit helped shape a clean, normalized schema for SQL Server, ensuring:
- ✅ Atomic fields for clean querying
- ✅ Lookup tables for repeated values
- ✅ Referential integrity across relationships
- ✅ Legal and ethical safeguards by avoiding establishment-level exposure
Schema Design
✅ Final Tables
| Table | Key Fields & Notes |
| Establishment | ID, Name, TypeId, Address, Status, Geo |
| EstablishmentType | TypeId, TypeName |
| Inspection | ID, Date, Outcome, AmountFined |
| Infraction | ID, Code, Description |
| InspectionInfraction | UniqueId, Severity, Action, FK links |
🔗 Relationships
- Establishment.TypeId → EstablishmentType.TypeId
- Inspection.EstablishmentId → Establishment.EstablishmentId
- InspectionInfraction.InspectionId → Inspection.InspectionId
- InspectionInfraction.InfractionId → Infraction.InfractionId
SQL scripts enforce referential integrity and prepare the backend for Power BI import.
Python ETL Pipeline
The ETL pipeline handles:
- ✅ CSV ingestion and column cleanup
- ✅ Splitting compound fields (e.g., Severity, Address)
- ✅ Logging dropped rows to dropped_rows.csv
- ✅ Resolving foreign keys (TypeId, InfractionId)
- ✅ Inserting into SQL Server using sqlalchemy and pandas
python
# Sample: Logging dropped rows
dropped = df[df['Inspection ID'].isna() | df['Infraction Details'].isna()]
dropped.to_csv(DROPPED_PATH, index=False)
log(f"Logged {len(dropped)} dropped rows to {DROPPED_PATH}.")
Full code available [download provided later]
Power BI Dashboard
🔗 Data Model (Star Schema)
- Fact Tables: Inspection, InspectionInfraction
- Dimensions: Establishment, EstablishmentType, Infraction
- Relationships: One-to-many, cross-filter direction set to “Both”
🧮 Key Measures (DAX)
- Total Inspections
- Pass Rate, Conditional Pass Rate
- Pass Count, Fail Count, Conditional Pass Count
- Average Infractions per Type
- Infraction Count
- StatusBreakdown table for donut chart
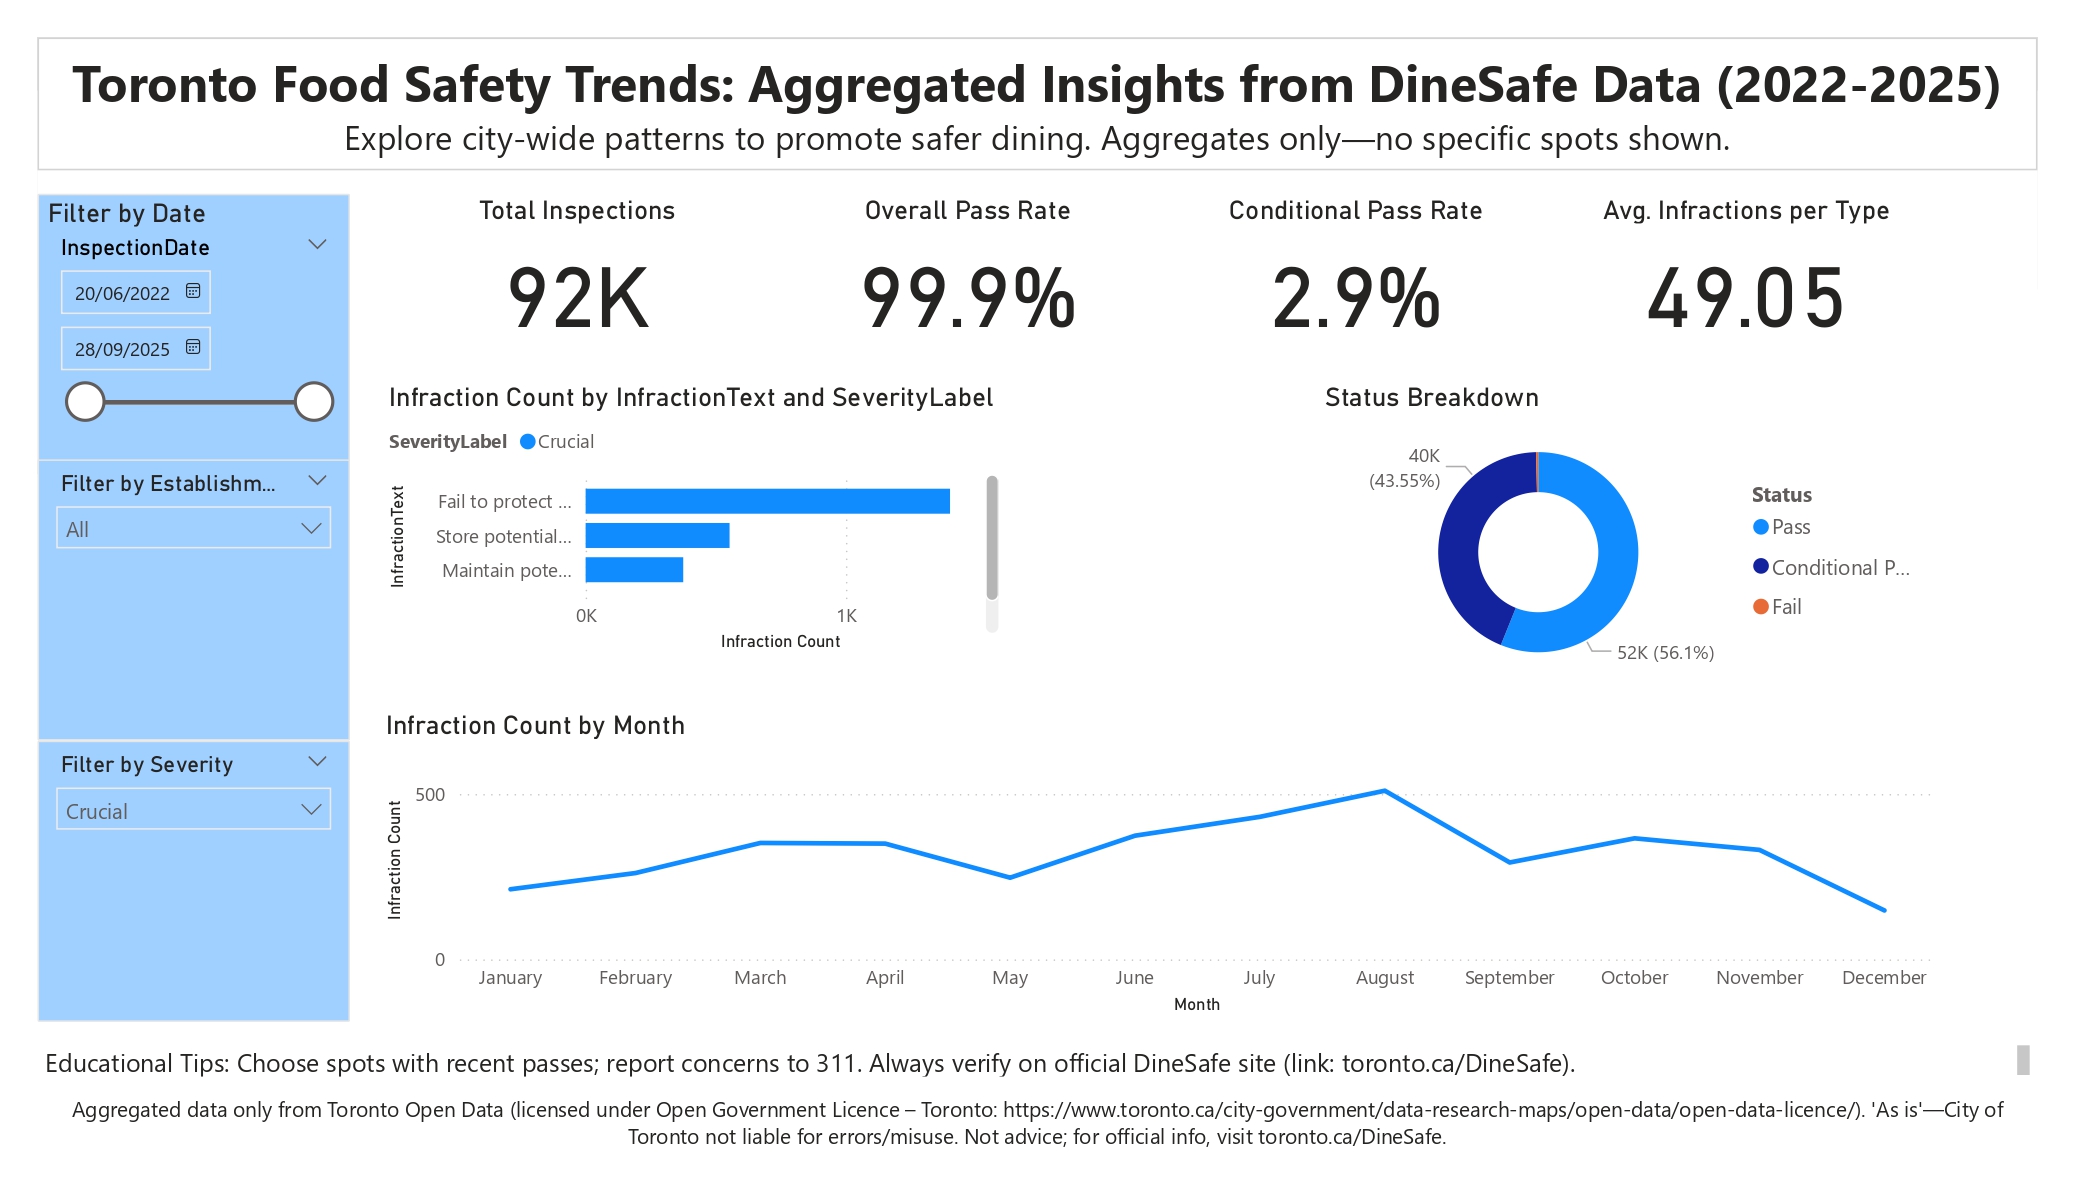
🖼️ Visual Layout (Single Page)
| Section | Visual Type | Purpose |
| Title Banner | Text box | Sets tone, no data |
| Slicers | Date, Type, Severity | Filters for public exploration |
| Key Metrics | Cards | Snapshot of citywide safety |
| Donut Chart | Status Breakdown | Pass vs Conditional vs Fail |
| Stacked Bar Chart | Top 5 Infractions | Severity breakdown |
| Line Chart | Trends Over Time | Monthly patterns |
| Details Section | Text box | Educational tips |
| Disclaimers | Text box | Legal protection |
🧠 Design Philosophy
- Ethical: No establishment-level exposure
- Credible: Inferred logic documented and defensible
- Transparent: Disclaimers and methodology included
- Accessible: Mobile-friendly layout and slicers
- Professional: SQL normalization, modular ETL, clean DAX
How to Explore the Project
- If you don’t wish to explore the interactive version then view the Dashboard PDF here (DineSafe PDF Dashboard).
- If you wish to explore the interactive version then follow the below steps (technical know how required):
- Create a project folder
- Place the project files in the project folder i.e. Raw CSV Dataset, SQL Script, ETL Python Script, Power BI Dashboard PBIX file) (Download DineSafe Project )
- Connect to your SQL Server instance
- Run the SQL schema script (from your project folder)
- Run the ETL script (from your project folder)
- Open the Power BI file in Power BI Desktop
- Explore visuals, slicers, and tooltips
🚫 Limitations
- Power BI Service publishing unavailable at present
- Aggregates only—no individual restaurant data shown
📜 Licence & Attribution
This dashboard uses publicly available data from the Toronto Open Data Portal and is governed by the Open Government License – Toronto.
Key points:
- The data is provided “as-is” by the City of Toronto.
- The City of Toronto makes no representations or warranties regarding accuracy, completeness, or fitness for purpose.
- This dashboard is for educational and informational purposes only.
- It does not constitute legal, health, or safety advice, and should not be used to make decisions about individual establishments.
- Users are encouraged to verify inspection details directly on the official DineSafe website.
- ⚠️ No endorsement by the City of Toronto is implied. All interpretations, visualizations, and inferences are solely those of the author.